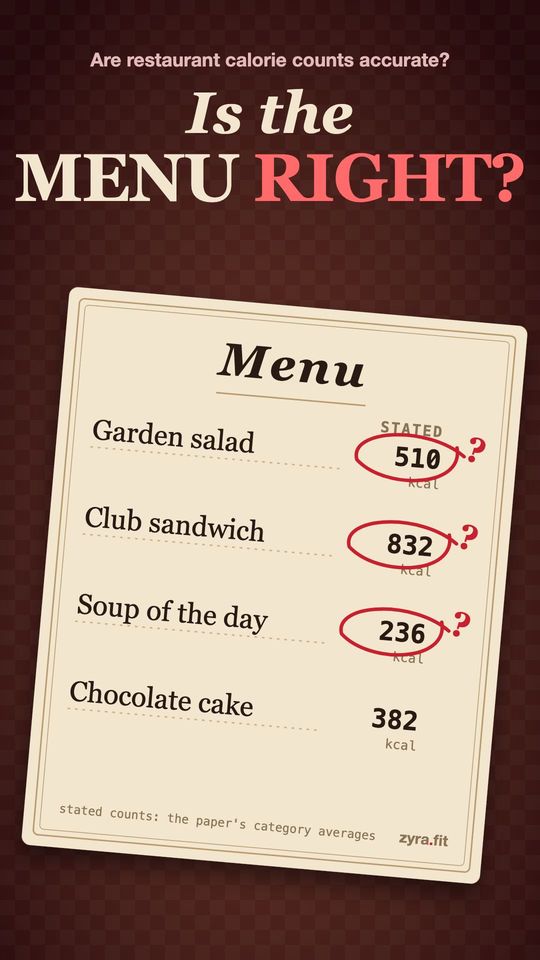
On average, yes; for a single dish, not always. When researchers bought 269 dishes from US chain restaurants and measured their energy in a lab, the menu figures were only about 10 kcal per portion off on average, but nearly one dish in five held at least 100 kcal more than stated2.
So a menu number is a fair guide across many meals and a rough one for any single plate. This article explains how the tests were done, where the misses cluster, and what a 2024 study of labelled menus in England found.
How do you check a menu's calorie count?
You burn the food. The standard lab method is bomb calorimetry: the dish is blended, freeze-dried to a powder, and a sample is burned in a sealed chamber that measures the heat it gives off2. That heat is the food's gross energy.
A menu lists something slightly different: the energy your body can actually use, which is lower than gross energy because not everything is digested. So the researchers converted the stated figures with standard conversion factors before comparing2. (For why calorie figures are estimates built from factors, see why macros don't add up to calories.)
The key terms:
| Term | Meaning |
|---|---|
| Stated count | The calories the restaurant publishes for a portion |
| Measured count | What the lab found in the dish as served |
| Entree | The main dish |
| Side dish | What comes with the main: fries, rice, vegetables and so on |
| Quick-serve | Counter-service fast food |
| Sit-down | Table-service restaurants |
In plain terms: the lab measures what is actually on the plate, then puts it in the same units as the menu.
The 2011 study: 269 dishes, 42 restaurants
The largest study of its kind was published in *JAMA* in 20112. Between January and June 2010, researchers picked 42 restaurants at random from large US chains in Massachusetts, Arkansas and Indiana: quick-serve and sit-down. At each, they chose foods at random, two with high and two with low stated energy. They ordered as take-out and did not say who they were.
That gave 269 food samples, because sit-down side dishes were analysed separately from their entrees2.
On average, the menus were right
Across all 269 items, the stated figure averaged 555 kcal per portion and the measured figure 564. The difference, 10 kcal, had a 95% confidence interval of −15 to 34 kcal, which crosses zero, so it was not a clear difference2. (A confidence interval is the range the true value most likely sits in.) The authors concluded that stated energy contents "were accurate overall"2.
Dish by dish, they were not
Individual items scattered widely. About 40% measured at least 10 kcal above the menu, 52% at least 10 kcal below, and only 7% were within 10 kcal either way2. Fifty items, 19%, held at least 100 kcal more than stated. One side dish carried more than 1,000 kcal above its stated 450 kcal2.
Measured minus stated energy, by type of food · kcal/portion
The twist: lighter dishes ran over
In sit-down restaurants the error depended on the stated number. Entrees listed at 625 kcal or less tended to contain more than stated; entrees listed above 625 kcal tended to contain less2. The fitted line was: difference = 176 − 0.28 × stated energy. Quick-serve food showed no such pattern.
Side dishes at sit-down restaurants ran 58 kcal over on average (95% CI 13 to 102), while the entrees they came with ran 48 kcal under (95% CI −94 to −1)2. Carbohydrate-rich foods, as a group, were 81 kcal over (95% CI 23 to 140).
The authors pointed out the uncomfortable part. The lower-calorie choices are the ones a person trying to eat less is likely to pick, and those were the ones most often under-counted2.
The worst dishes stayed wrong
The team went back for the 10% of foods with the biggest excess. Thirteen of 17 were still on the menu. The first time they held 289 kcal more than stated (95% CI 186 to 392). Several months later, the same dishes held 258 kcal more (95% CI 154 to 361). The two results did not differ2.
In plain terms: the error on a given dish was not bad luck on one day. It was built into how that dish was made or served.
Why the numbers drift
The 2011 study found that the difference between stated and actual portion size predicted part of the error, though only a small part (R² 0.07)2. Items portioned at the factory before reaching the restaurant, as most fast food is, tended to be the most accurate. Sit-down food was more variable: the standard deviation of the error was 225 kcal for sit-down foods against 134 kcal for quick-serve2.
A 2025 study adds a second reason. Many businesses calculate their figures from standard recipes and ingredient databases, which may not match how a dish is actually cooked or portioned, and cooking method can change the energy content of the served food4.
An older, smaller study from the same group looked at reduced-energy dishes specifically. Measured energy in 29 restaurant items averaged 18% more than stated, some items held up to 200% of their stated value, and free side dishes pushed the energy served to 245% of the stated value for the entree on average1. The differences did not reach statistical significance because the items varied so much.
What about restaurants without calorie labels?
A 2016 study measured the most frequently ordered meals in non-chain restaurants in three US cities, which usually publish no nutrition information3. Meals averaged 1,205 kcal (standard deviation 465), not significantly different from equivalent chain meals. Ninety-two percent of meals held more energy than the authors' estimate of typical needs for a single eating occasion.
In plain terms: an unlabelled restaurant meal is not automatically lighter than a labelled one. It is just unmeasured.
Newer data: labelled menus in England, 2024
England made calorie labels mandatory in 2022 for large out-of-home food businesses (250 or more employees), with a 20% leeway between the stated and true value4. A 2024 study bought 295 menu items from cafes, pubs, restaurants, fast-food outlets and entertainment venues in two areas, Liverpool and Milton Keynes, and tested them by bomb calorimetry4.
The findings mirror the US result in a different way:
- On average, the menus slightly overstated energy. Measured energy was 16.7 kcal lower than reported, on average4.
- Individual items were often far off. The average size of the miss, ignoring direction, was 99 kcal or 21%. For 35% of items, the menu figure was outside the 20% leeway: 23% of all items were overstated by more than 20% and 11% understated by more than 20%4.
- Pubs were the least accurate. Forty-six percent of pub items fell outside the leeway, against 30–36% for the other outlet types4.
- Chains were consistent with themselves. The same item bought at two outlets of the same business measured similarly4.
Labelled menu items outside the 20% leeway, England 2024 · % of items
What this means when you log a meal out
Taken together, these studies describe a pattern rather than a rule. A menu figure is a good average and a noisy single number. The misses cluster in sit-down food, side dishes and lighter-sounding entrees, and they go both ways.
For a food log, that means a restaurant meal is one of the less certain entries. A steady error across many meals tends to wash out; a large miss on one heavy day does not. If you eat out often, your weight trend is the better judge of whether your log is right than any single menu figure (see how accurately do you need to track calories and calories in, calories out explained). That is our reading of the studies, not something they tested.
What the studies found
| Study | Who was studied | Key result | Year |
|---|---|---|---|
| Urban et al., *J Am Diet Assoc*1 | 29 reduced-energy restaurant dishes, 10 frozen meals (US) | Restaurant dishes averaged 18% more energy than stated; not significant because of wide variation | 2010 |
| Urban et al., *JAMA*2 | 269 items from 42 randomly chosen US chain restaurants, 2010 | Average 10 kcal above stated; 19% at least 100 kcal over; worst items still over months later | 2011 |
| Urban et al., *J Acad Nutr Diet*3 | Frequently ordered meals from non-chain and chain restaurants in 3 US cities | Non-chain meals 1,205 kcal on average, similar to chain meals | 2016 |
| Finlay et al., *Br J Nutr*4 | 295 labelled menu items from large businesses in England, 2024 | Average 16.7 kcal overstated; 35% of items more than 20% off | 2025 |
Limits worth knowing
- Food tested, not people. These studies measure dishes, not what anyone ate or how their weight changed.
- One sample per dish. Both big studies mostly tested each item once, so part of the scatter is dish-to-dish variation on the day24.
- Take-out only in the 2011 study; food eaten in the restaurant was not tested2.
- Time and place. The US data are from 2010, and the England data cover large businesses in two areas; menus change.
- The lab method reads slightly low. The authors of the 2011 study note their technique under-recovers energy a little, which, if anything, would widen the excess they found.
- Abstracts only for the 2010 and 2016 studies.
- Funding. The 2025 study was mainly funded by the University of Liverpool Policy Support Fund; one author has received unrelated industry funding4.
Latest research
The newest study we opened is the 2025 analysis of England's mandatory menu labels, with food bought in 20244. Two years into the policy, the average label was close, slightly overstating energy, but about a third of items missed the true value by more than the 20% leeway, and pubs missed most often. We found no newer lab study of US menus since 2011; when one appears, this page will be updated.
The short version
- Restaurant calorie counts are close on average: 10 kcal per portion in the US study, 17 kcal in England.
- Single dishes can be far off: 19% of US dishes held 100 kcal or more above the menu.
- Lighter sit-down entrees and side dishes were the most under-counted.
- A menu figure is a reasonable log entry; your weight trend shows whether the total is right.
Educational overview only — not medical advice.